Struggling to keep up with your agents?
Getting a headache from the amount of code?
One command and you're good.
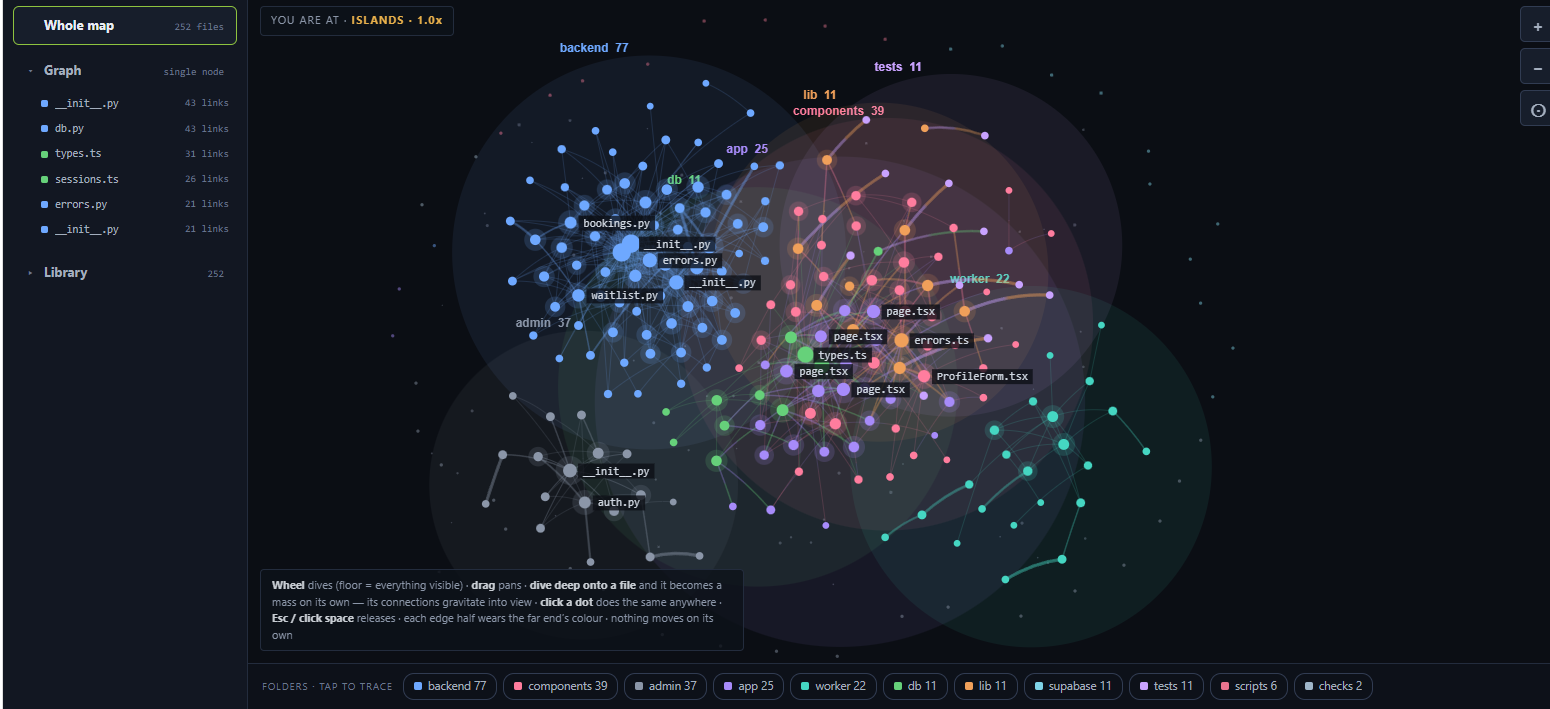
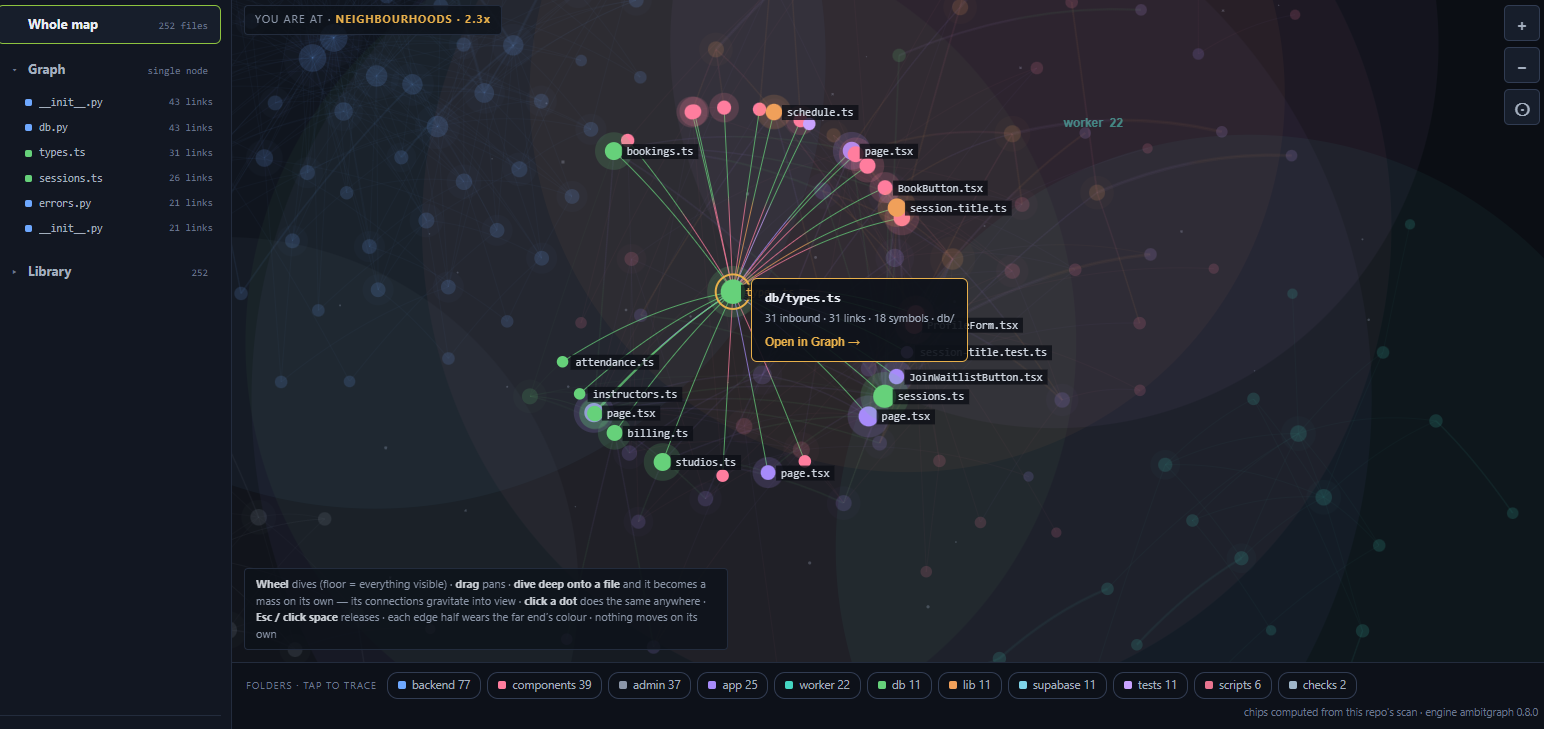
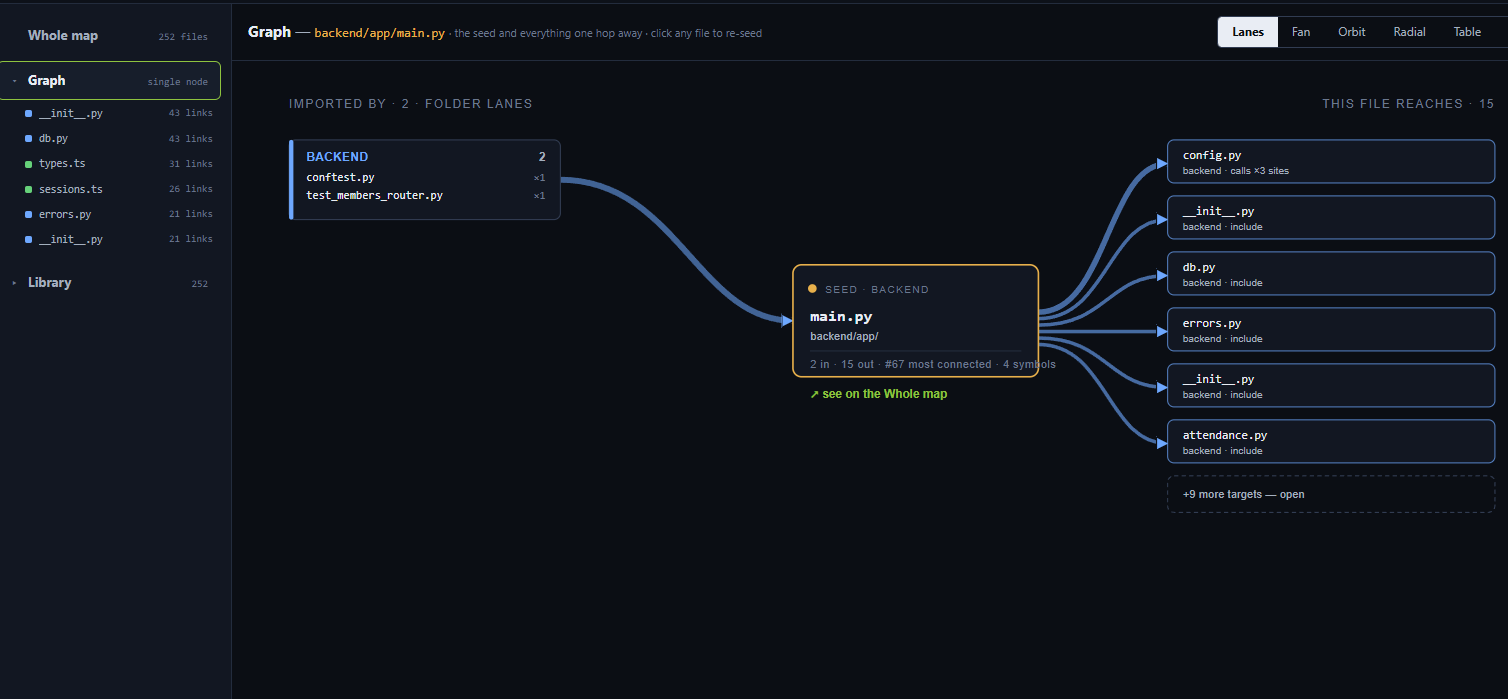
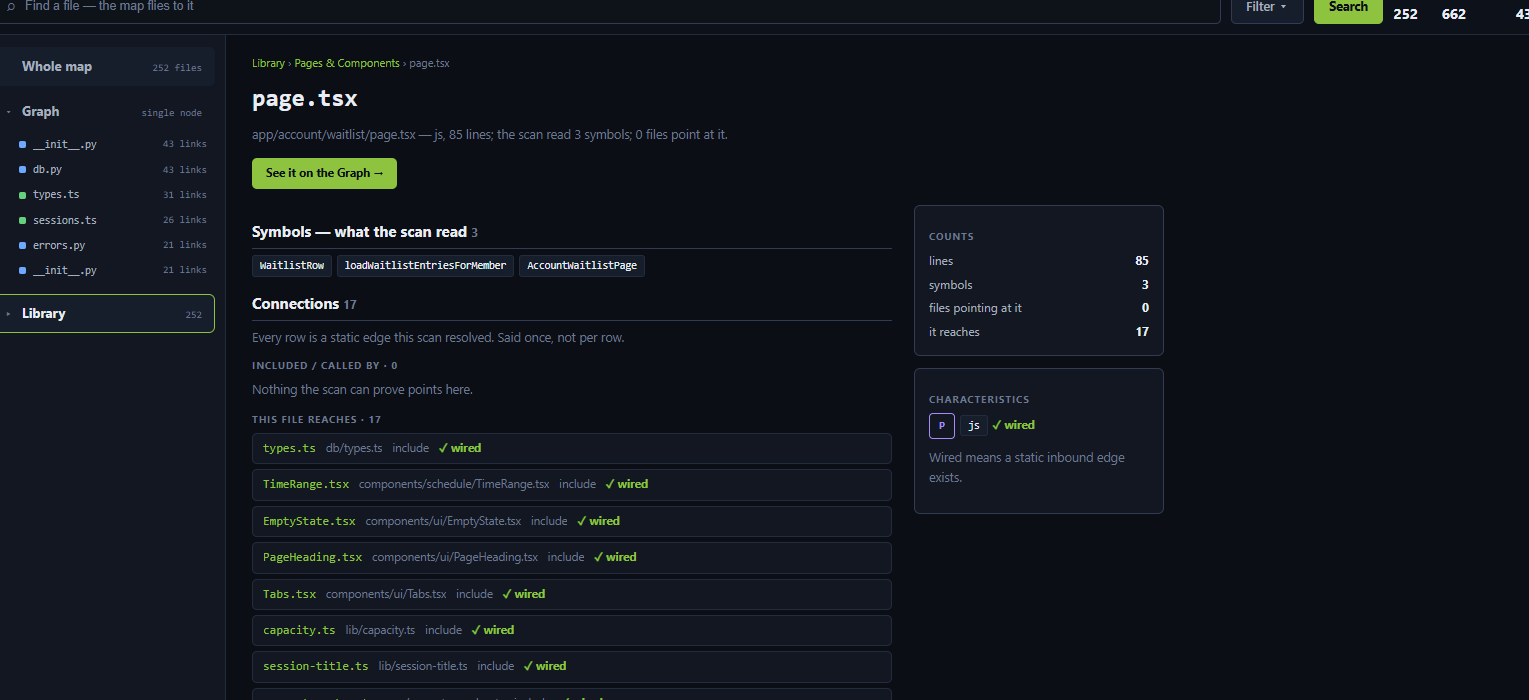
Deterministic. No tokens. Or with YOUR LLM. We are here to help you lift your cognitive burden, reduce your headaches.
AmbitGraph draws your whole repo as a visual interactive map & library and gives them to you. It needs Python on your machine, never in your project. Free, offline, no account, no API key.
How you run it
It reads the folder, opens the map in your browser, and keeps serving in the background while you work. Your codebase is displayed in your browser as local webpages. It does not make any changes to your codebase.
Who we are
AmbitGraph shares tools we built for ourselves. They started as internal instruments for our own projects — the things we needed to keep up with our own code, and with the agents writing in it — and we are opening them up for other people's projects.
The map is the first one out. There is a lot more coming, being adapted from internal use into something a stranger can pick up and run.
That is also why things appear here as in testing before they appear on the package index. A tool we use every day is not the same as a tool that is ready for someone else's machine, and we would rather say which is which.
shaked@ambitgraph.com
Shaked Mann on LinkedIn
Yonatan Levy Nahum on LinkedIn
What you look at, and what runs under it
Omniscient — the screen
The map, the library and the search in one place. It is the part you touch, and the only part you need to learn. See Omniscient →
The services — the work
The scan reads your code, the map draws what it resolved, and Telegraph tracks who is responsible for what. They run underneath and write what the screen shows.
What it does
It draws
Modules, classes, imports, calls, DB tables — anything in your code, mapped on its connections.
It indexes
Every unit and function in the repository, grouped into a library you can search by name.
It stays yours
The map is served to your own machine and stays there. It makes no changes to your codebase.
No AI is required
No model runs, no tokens burn, no key exists. If you want more than the map, your own assistant can work on top of it, on your own subscription. Optional, always.
What it reads
The map is plain reading of your code. Depth varies by language — the graph page says exactly how far each one is read.
- Python
- JS
- TS
- Java
- JSP
- Ruby
- C
- C++
- Swift
- Go
- SQL
- shell
Five frameworks by name: FastAPI, Flask, Next.js and Express for your routes, and Supabase for your tables.
If a language is not on that list
You can still map it, using your own assistant to do the reading. Your subscription, your model, your machine.